GMTで出てくるcolormapはきれいなのでMATLABでも使ってみたくなる時がある.
GMT風のcolormap生成functionがないかなと思ったら,案の定あった.
Kelly Kearneyさん作成のColor Palette Tables (.cpt) for Matlab (https://jp.mathworks.com/matlabcentral/fileexchange/28943-color-palette-tables-cpt-for-matlab)を使ってみる.
- matlab file exchangeからfunctionをダウンロードする
- addpathでcptcmap, minmax, parsepvをパスに追加しておく
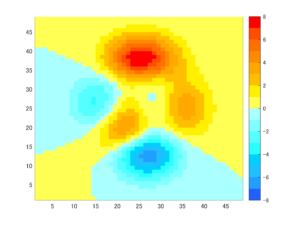
figure
pcolor(peaks);shading flat
cptcmap('GMT_no_green', 'mapping', 'direct')
caxis([-8 8])
colorbar
試しにno_greenを使ってみると以下の図ができた.
他にもいろいろ試してみる(今後追記予定です)