
Pythonで図面を書く時のライブラリ.(参考サイト:matplotlib入門 りんごがでている,早く知っておきたかったmatplotlibの基礎知識、あるいは見た目の調整が捗るArtistの話 – Qiita)
実は,matplotlibには二つの方法がある.(名前は参考サイトに則りました.)
- オブジェクト指向インターフェース(fig, ax = plt.subplots()等の後にax.plotなどで描く方式)
- Pyplotインターフェース(plt.subplot()などplt.XXXで描く方式)
オブジェクト指向インターフェース
その名の通りオブジェクト指向でプロットする.細かいところも修正できるのでこっちを採用.
基本的な使い方
- matplotlibをimportする
- fig, ax = plt.subplots()で新規のFigureとAxesのインスタンスを作る.
- プロットする(例:ax.plot(x,y))
- 軸の調節・グラフタイトルとラベルの編集
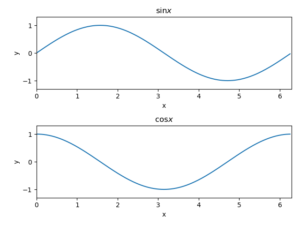
サンプルコード(y=sinxとy=cosxを描く)
# import libraries
import matplotlib.pyplot as plt
import numpy as np

# parameters
pi = np.pi
x = np.arange(0, 2*pi, pi/100)
y_sin = np.sin(x)
y_cos = np.cos(x)

# 1. make Figure and Axes instance
fig, (ax1, ax2) = plt.subplots(2, 1)

# 2. plot data

# # y = sinx
ax1.plot(x, y_sin)
# # y = cosx
ax2.plot(x, y_cos)

# 3. figure configuration

# # adjust axes
# # # x axis
ax1.set_xlim(0, 2*pi)
ax2.set_xlim(0, 2*pi)

# # # y axis
ax1.set_ylim(-1.3, 1.3)
ax2.set_ylim(-1.3, 1.3)

# # title
ax1.set_title("$\sin x$")
ax2.set_title("$\cos x$")

# # label

# # # x
ax1.set_xlabel("x")
ax2.set_xlabel("x")

# # # y
ax1.set_ylabel("y")
ax2.set_ylabel("y")


# axis tight
fig.tight_layout()

# show figure
plt.show()
結果
Pyplotインターフェース
MATLABみたいな方式で,描くaxisやfigureを指定しなくても勝手にプロットしてくれる.簡単だけど,細かい微修正がやりにくい.
基本的な使い方
- matplotlibをimportする
- plt.figure()で新規のFigureインスタンスを描画する
- プロットする(例:plt.plot(x,y))
- plt.showで図面に出力する
サンプルコード(y=sinxの曲線を描く)
# import libraries
import matplotlib.pyplot as plt
import numpy as np

# parameters
pi = np.pi
x = np.arange(0, 2*pi, pi/100)
y_sin = np.sin(x)
y_cos = np.cos(x)

# 1. make Figure instance
plt.figure()

# 2. plot data
# # sin
plt.subplot(211)
plt.plot(x, y_sin)
# # # figure configuration
ax1 = plt.gca()
ax1.set_xlim(0, 2*pi) # --- 結局ここでaxのメソッドを使う
ax1.set_ylim(-1.3, 1.3)
ax1.set_xlabel("x")
ax1.set_ylabel("y")
ax1.set_title("$\sin x$")

# # cos
plt.subplot(212)
plt.plot(x, y_cos)
# # # figure configuration
ax2 = plt.gca()
ax2.set_xlim(0, 2*pi) # --- 結局ここでaxのメソッドを使う
ax2.set_ylim(-1.3, 1.3)
ax2.set_xlabel("x")
ax2.set_ylabel("y")
ax2.set_title("$\cos x$")

# axis tight
fig = plt.gcf()
fig.tight_layout() # --- 結局ここでfigのメソッドを使う

# 3. show figure
plt.show()
結果
各コマンドについて
これから追加していくよ.よろしくやで.
- plt.plot
- plt.contour
- plt.savefig