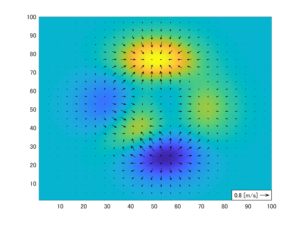
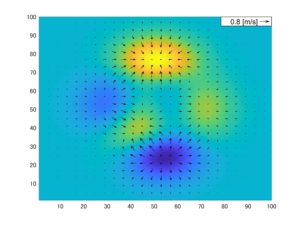
流速や運動量フラックスを矢印プロットする際に,矢印の大きさのreferenceがあると便利である.
方法
Andrew Robertsさんが作成・公開しているncquiverrefがおすすめ
- https://jp.mathworks.com/matlabcentral/fileexchange/17582-ncquiverref
使い方
% Syntax
ncquiverref(x,y,u,v,units,reftype,refvec,veccol,cont)
x: x座標 or 緯度の座標,y: y座標 or 経度の座標,units: 単位,reftype: referenceとなるベクトルの大きさ,大きさは’median’で中央値,’max’で最大値とすることができる,refvec: ‘True’でreferenceをプロットする,veccol: ベクトルの色 ‘col’にするとコンターになる,cont: コンターのレベル
例
peaks関数から勾配を求め,カラープロットにオーバーラップさせる
% peaks
A = peaks(100);

% Aの勾配を求める
[Ax, Ay] = gradient(A);

% 10メッシュごとにベクトルを間引きする
grid = 4;
vel_x = Ax(1:grid:size(A),1:grid:size(A));
vel_y = Ay(1:grid:size(A),1:grid:size(A));

% meshgridで100x100のメッシュを作成
[X, Y] = meshgrid(1:grid:100,1:grid:100);

% pcolorでプロット
figure;
pcolor(A);shading flat
cmap = parula;
colormap(cmap)
hold on


% quiverでプロット
units = '[m/s]';
reftype = 'max';
refvec = 'True';
veccol = 'k';
cont = 0;
ncquiverref(X, Y, vel_x, vel_y, units,reftype,refvec,veccol,cont)
出力結果

下にreferenceが入るのがわかる.
Tips的なもの(随時加筆修正します)
- referenceのfontを変えたい
ht=text(xstart,yp1+pady,reftext,'Visible','off','FontSize',8.5,...
%         'VerticalAlignment','Bottom','HorizontalAlignment','Right');
と
% Redraw reference text on top of patch
 ht=text(xstart,(yb+yt)/2,2.1,reftext,'FontSize',8.5,...
         'VerticalAlignment','Middle','HorizontalAlignment','Right');
の部分に’FontName’と値を加える.FontSizeも変更可能
- referenceの位置を変えたい
% Draw patch over area of vector key
 xl=textextent(1)-padx;
 xr=xp2;
 yb=yp1;
 yt=textextent(2)+textextent(4)+pady;
 hp=patch([xl; xl; xr; xr],[yb; yt; yt; yb],[2; 2; 2; 2],'w',...
          'LineWidth',0.5);
 uistack(hp,'top');
のxl(左端), xr(右端), yb(下端), yt(上端)を調節すると位置が変えられる.
右上に持ってくるときは以下のようにした
% Draw patch over area of vector key
 xl=textextent(1)-4*padx;
 xr=xp2;
 yb=yp2-5*pady;
%  yt=textextent(2)+textextent(4)+pady;
 yt =yp2;
 hp=patch([xl; xl; xr; xr],[yb; yt; yt; yb],[2; 2; 2; 2],'w',...
          'LineWidth',0.5);
 uistack(hp,'top');
結果

補足(2019/9/13追加)
毎回functionのコードをいじりまくるよりも,
function q = ncquiverref(x,y,u,v,units,reftype,refvec,veccol,cont)

(中略)

  % Plot the vectors
  hd{i} = line(lx,ly,'Color',hc(i,:));

(中略)
 % generate the colorbar and get its dimensions
 hcb=colorbar('peer',gca,'location','EastOutside');
 q.hd_ref = hcb;
(中略)

 % Plot the vectors
 hd = line(lx,ly,'Color',veccol);
(中略)

% Redraw reference text on top of patch
 ht=text(xstart,(yb+yt)/2,2.1,reftext,'FontSize',8.5,...
         'VerticalAlignment','Middle','HorizontalAlignment','Right');
q.ht = ht;

(中略)
 % Plot the reference vector
 hd_ref = line(lx,ly,lz,'Color',veccol);
 q.hd_ref = hd_ref;
else

 disp('No reference vector is being plotted')

end

(ここから追加)
q.hd = hd;


end
として,quiverを描いているlineのハンドルとreferenceを描いているtextのハンドルを構造体に入れ込んで,呼び出せるようにするほうが楽かも.
実際,
q = ncquiverref(X, Y, vel_x, vel_y, units,reftype,refvec,veccol,cont);

for i = 1:1:length(q.hd)
    q.hd(i).LineWidth = 1; % --- 各ベクトルに対して変更することに注意
end
q.ht.FontName = 'Times';
で変更することができた.
