
MATLABで複数のプロットを同じfigureで用いるときはsubplotを使っていたがMATLAB R2019bからはtiledlayoutという関数が使える.
以下に例を示す.(参考:https://jp.mathworks.com/help/matlab/ref/tiledlayout.html)
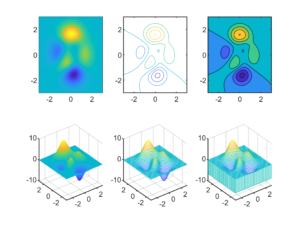
[X,Y,Z] = peaks(49);

fig = figure(1);

% --- TiledChartLayoutの作成
t = tiledlayout(2,3); % tiledlayout(m,n) m行n列

% --- 1枚目の図 ---
ax(1) = nexttile;
pcolor(X,Y,Z)
shading flat

% --- 2枚目の図 ---
ax(2) = nexttile;
contour(X,Y,Z)

% --- 3枚目の図 ---
ax(3) = nexttile;
contourf(X,Y,Z)

% --- 4枚目の図 ---
ax(4) = nexttile;
surf(X,Y,Z)
shading interp

% --- 5枚目の図 ---
ax(5) = nexttile;
mesh(X,Y,Z)

% --- 6枚目の図 ---
ax(6) = nexttile;
meshz(X,Y,Z)
結果
詳しい説明は↓も参考になる.
https://www.hydrocoast.jp/index.php?MATLAB/tiledlayout